ProjectsPersonal
Home automation with Home Assistant
A Raspberry Pi watching the whole house — power, water, HVAC, leaks and weather — with the config under version control
Most of the house projects on this site solved one problem each and then sat there. The hot water recirculation loop has its own controller. The thermostats have their own schedules. The energy monitor has its own app. Home Assistant is the layer that ties them together and, more importantly, keeps the history.
Before it, running this house meant five or six vendors and five or six apps — Tuya, Feit, SmartThings and the rest — none of which knew the others existed. Worse, all of it was Wi-Fi, which in practice means all of it was tied to somebody’s cloud service. Those services were unreliable at best and untrustworthy at worst: a light switch that stops working because a company you never chose to depend on is having a bad afternoon, and a running record of when you are home sitting on a server you cannot see.
Home Assistant got everything under one roof, and moved most of it off Wi-Fi and onto Zigbee. A handful of integrations still need the internet, but the majority of the house is now controlled locally.
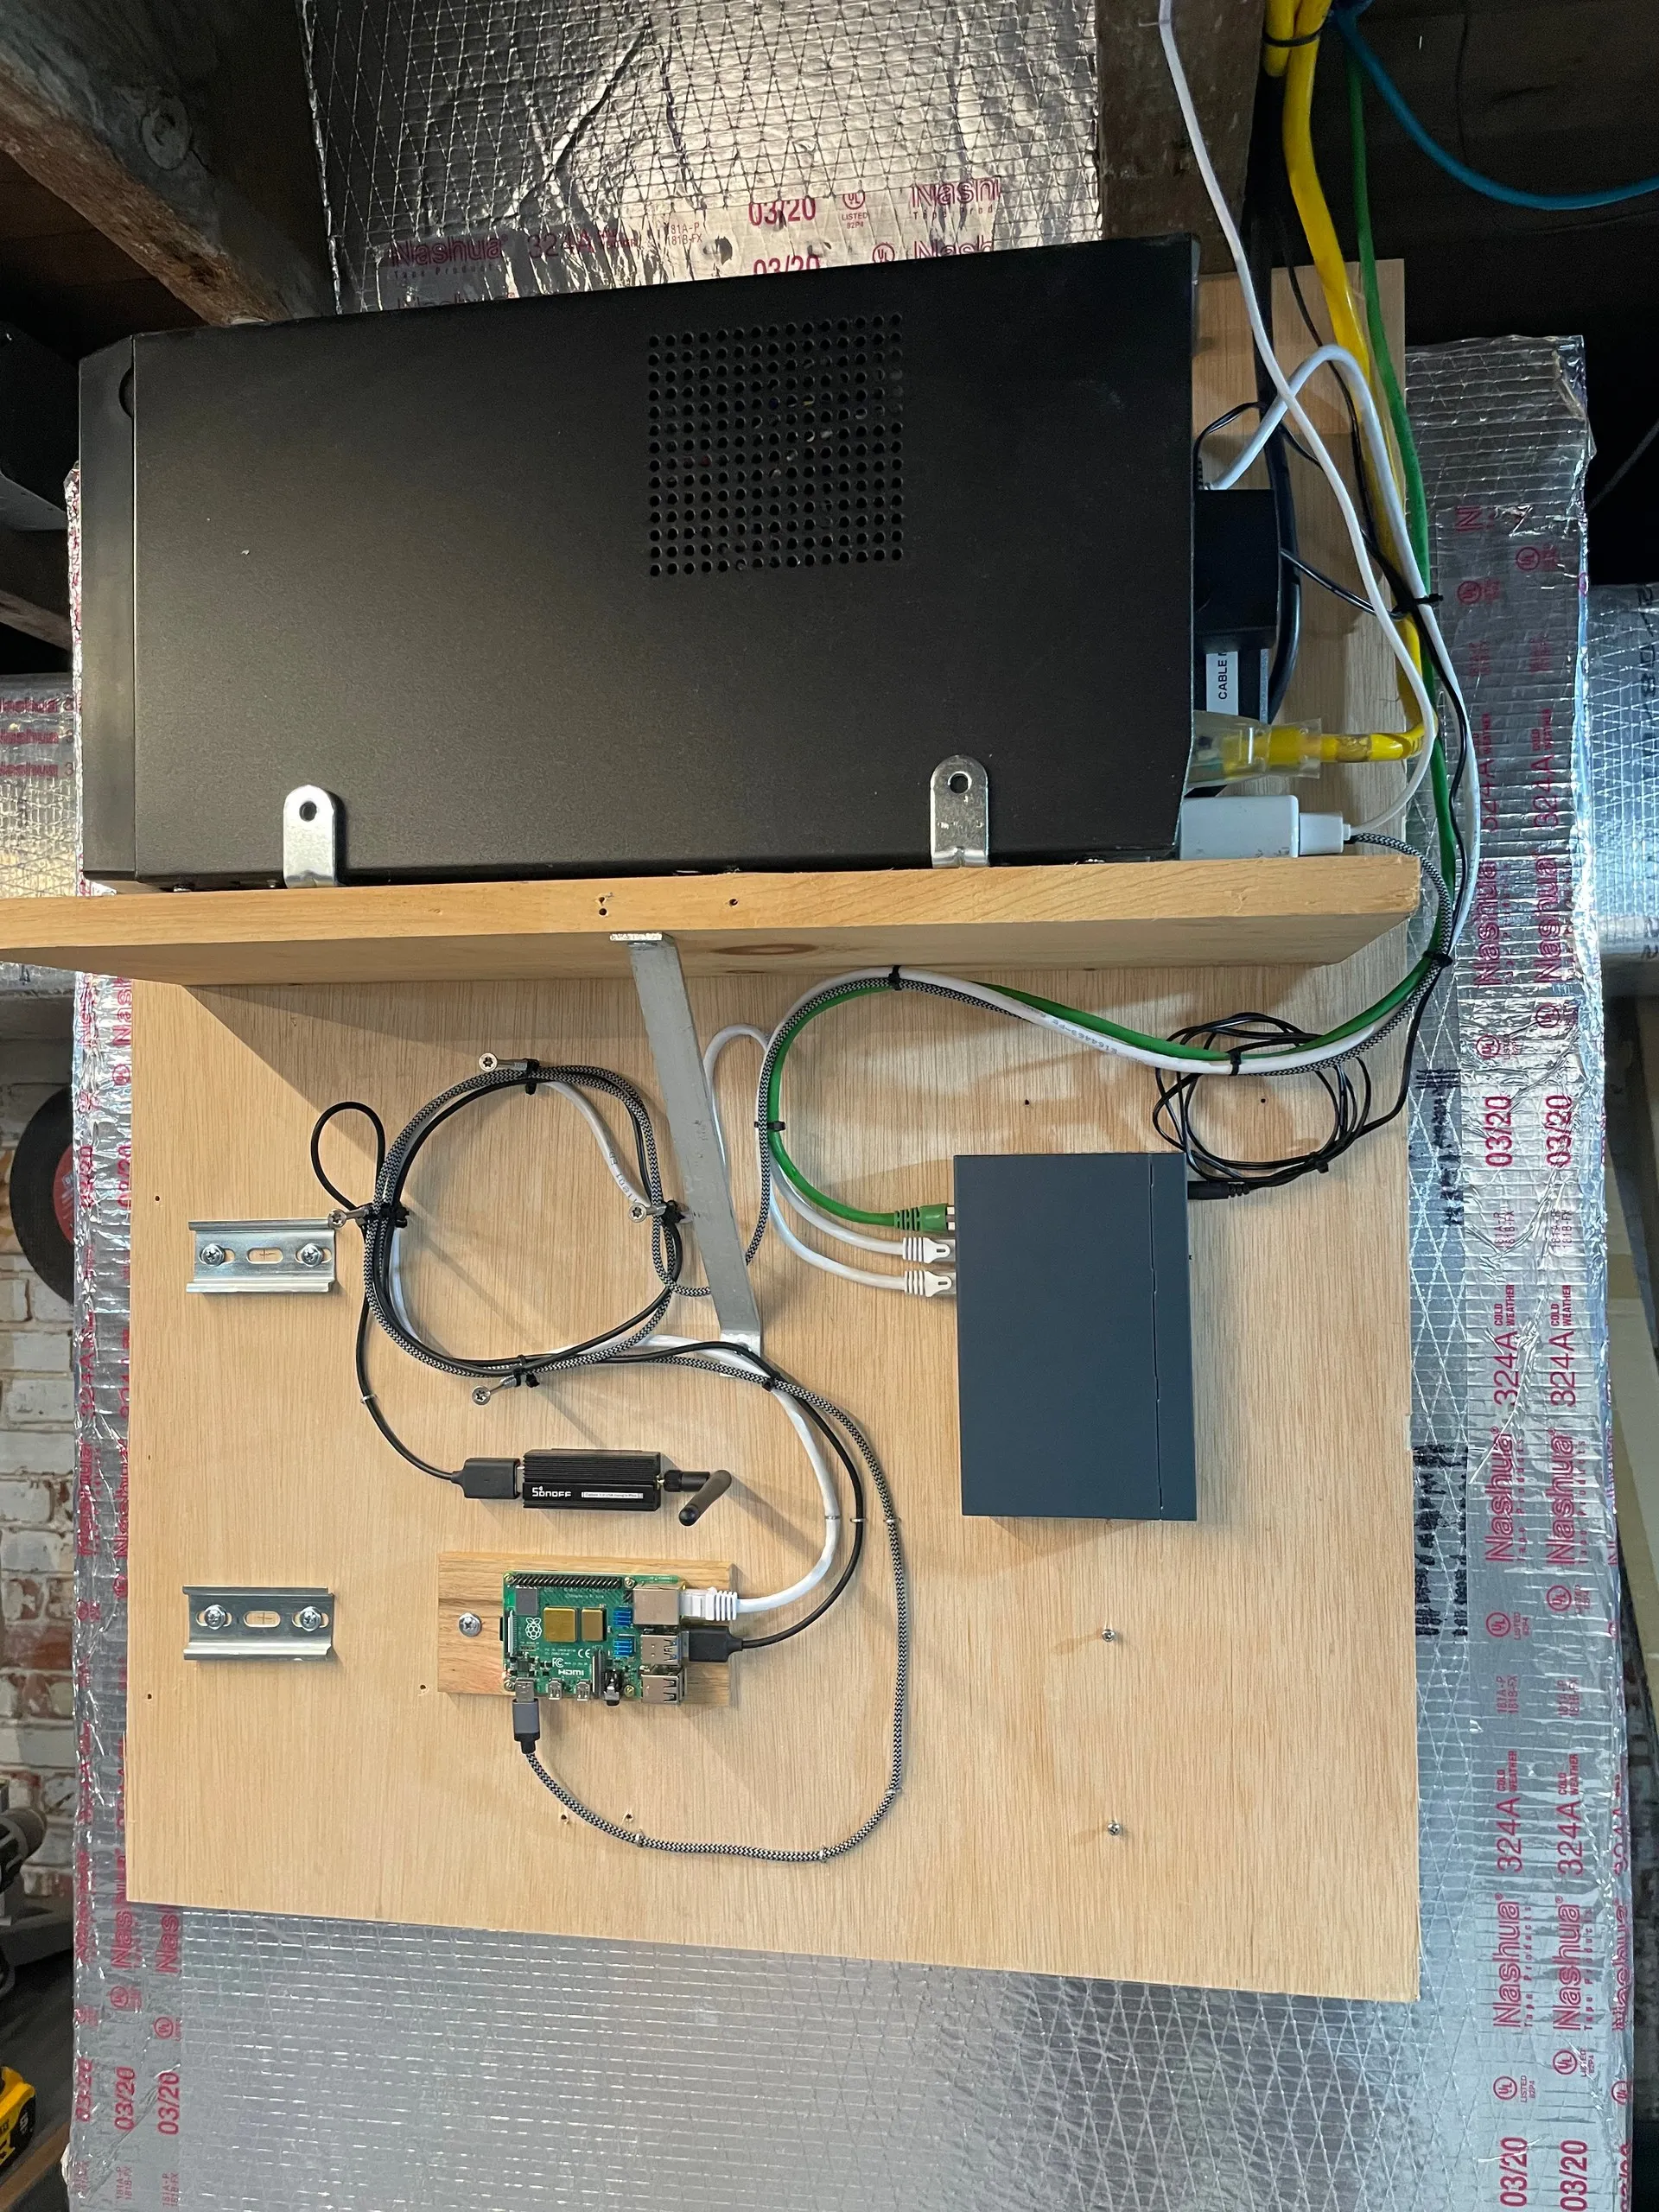
That is the whole installation. A Raspberry Pi 4 on a plywood panel, a Sonoff Zigbee coordinator on a USB extension so it is not sitting against the Pi’s own RF noise, a network switch, and an APC UPS on the shelf above. Two DIN rails are mounted and empty — room for whatever comes next.
What it watches
Roughly 60 sensors, most of them Zigbee, feeding six dashboard views.
The three that get looked at most:
Electrical. A Sense monitor on the panel reports whole-house power and both line voltages. Incoming voltage sits around 122 V and wanders a couple of volts across the day, which is normal and interesting to watch anyway.
Water. A metering shutoff valve on the main reports pressure and daily consumption, and can close remotely. Leak detectors sit at the laundry room and under the upstairs air handler — the two places in this house where a leak would otherwise be found by the ceiling below it.
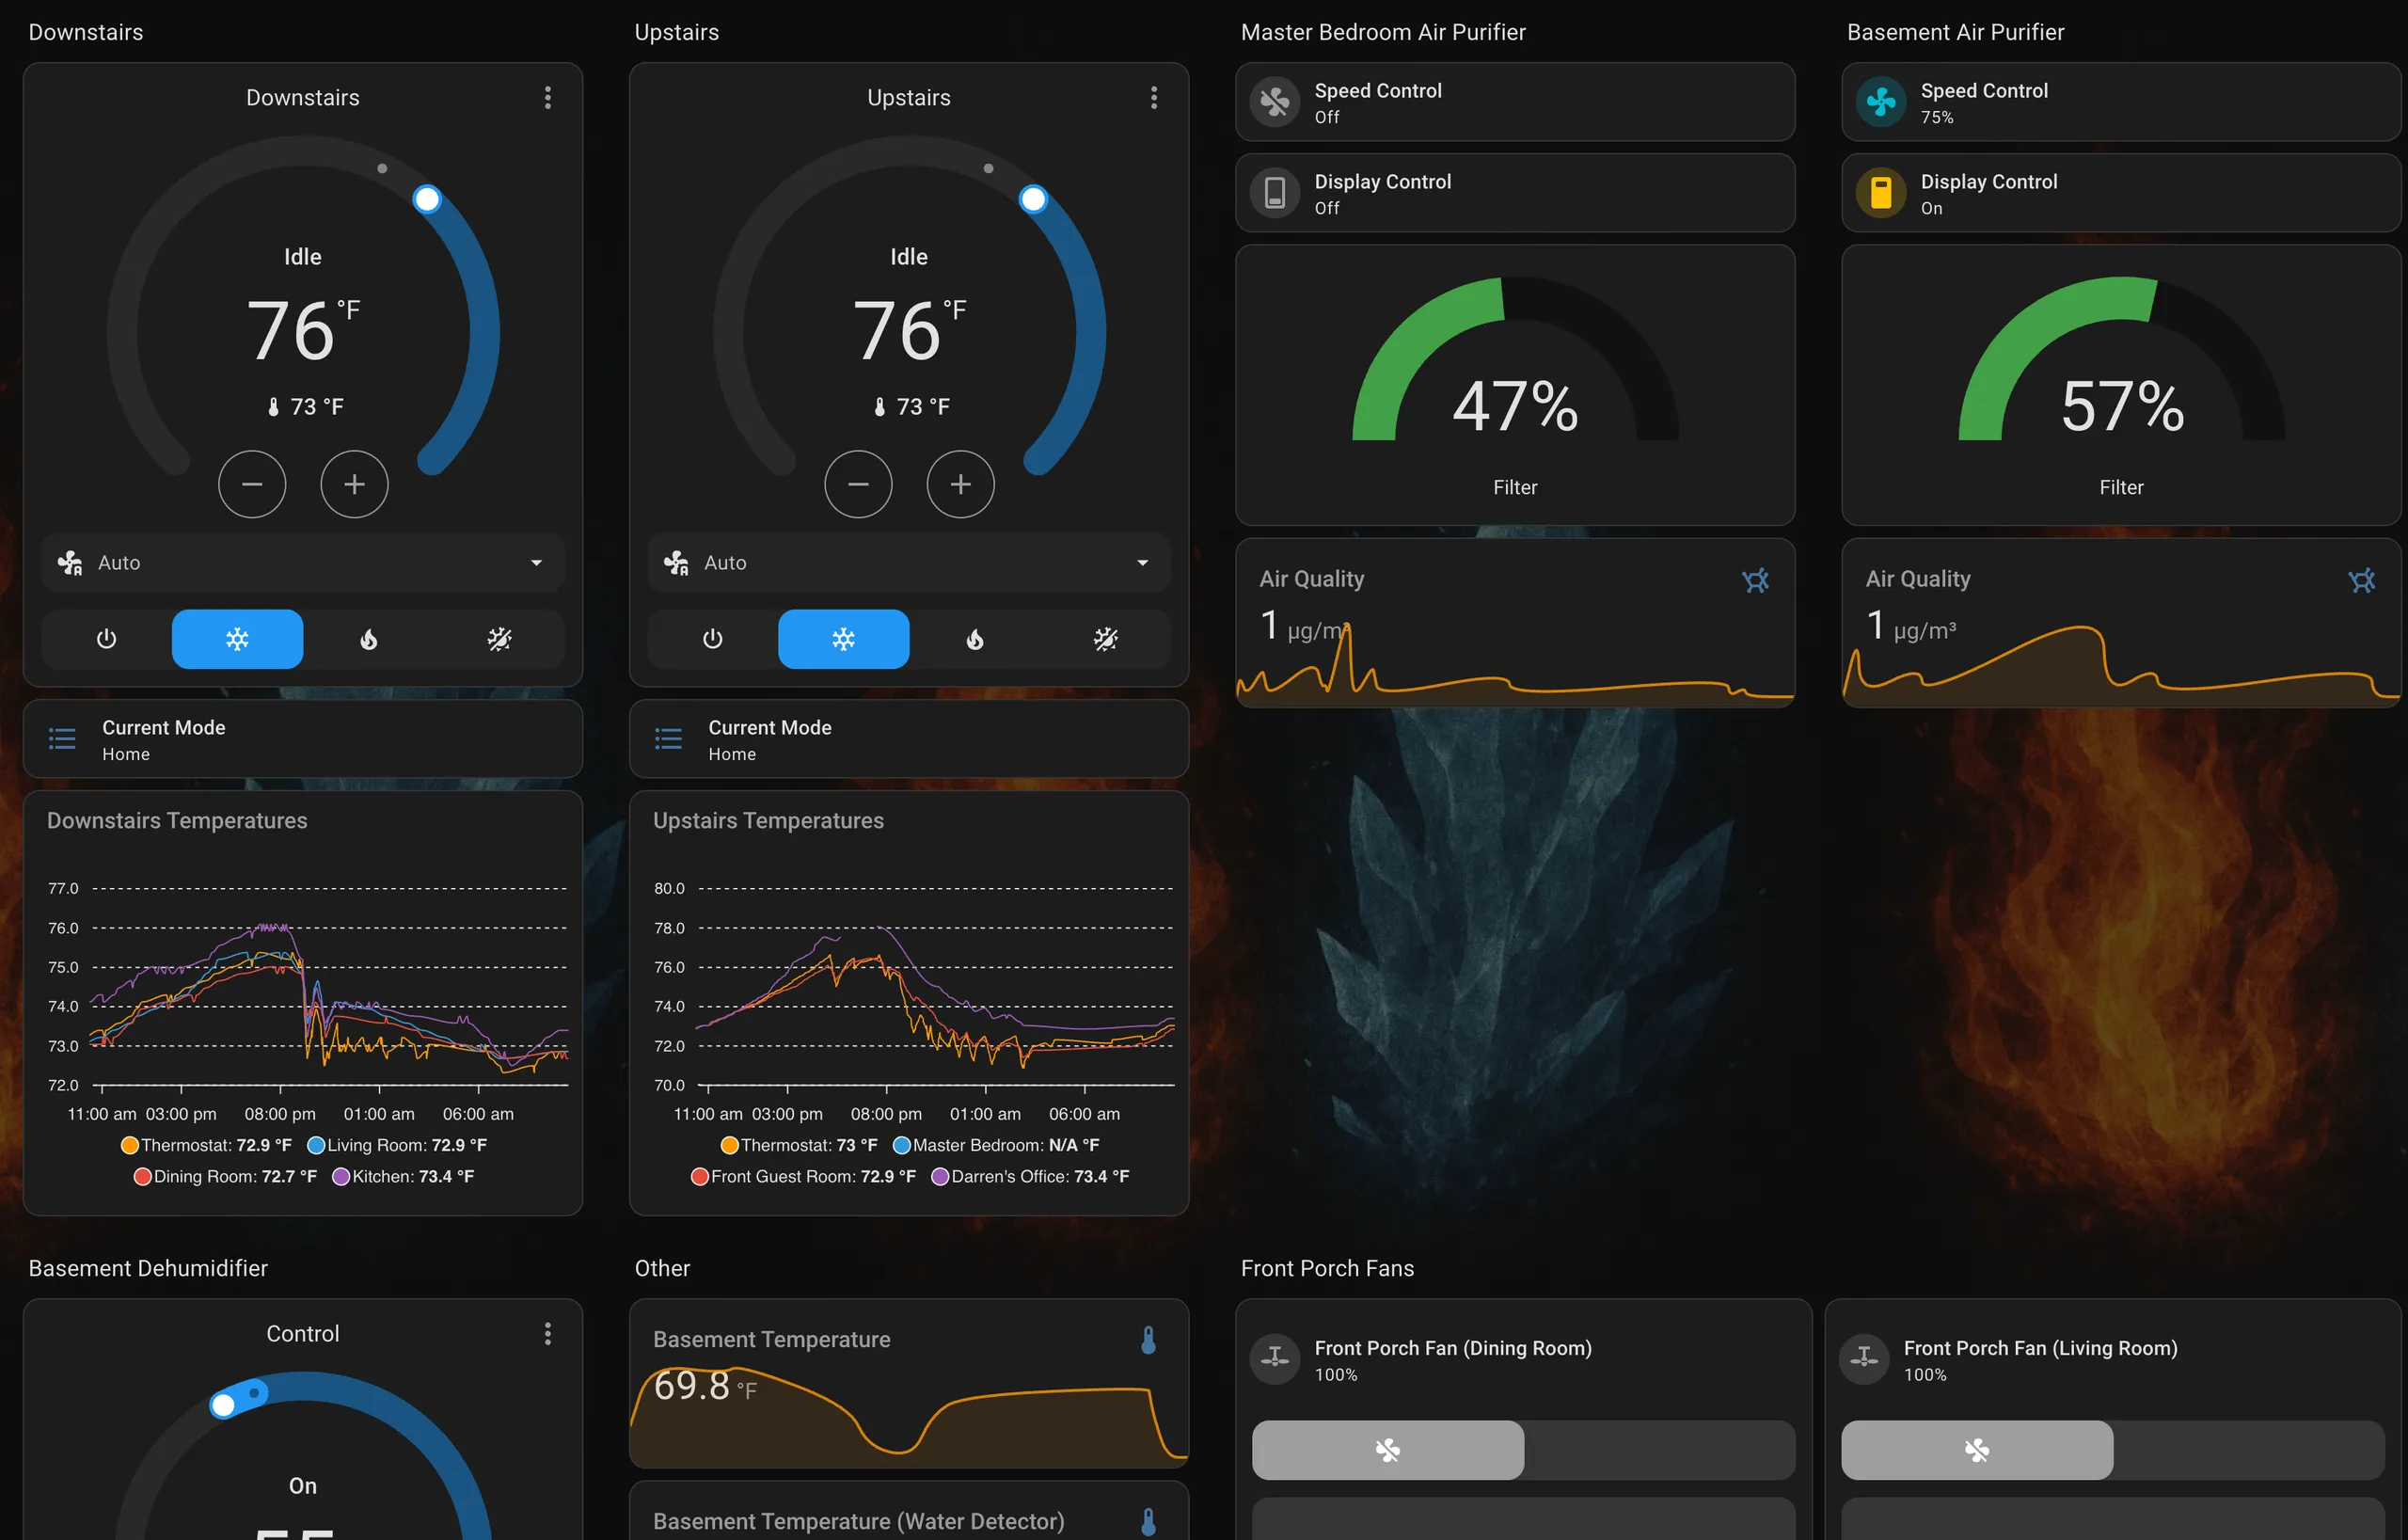
HVAC. Two thermostats, one per zone, plus a temperature sensor in each of six rooms. That per-room data is what made the circulation automation below possible.
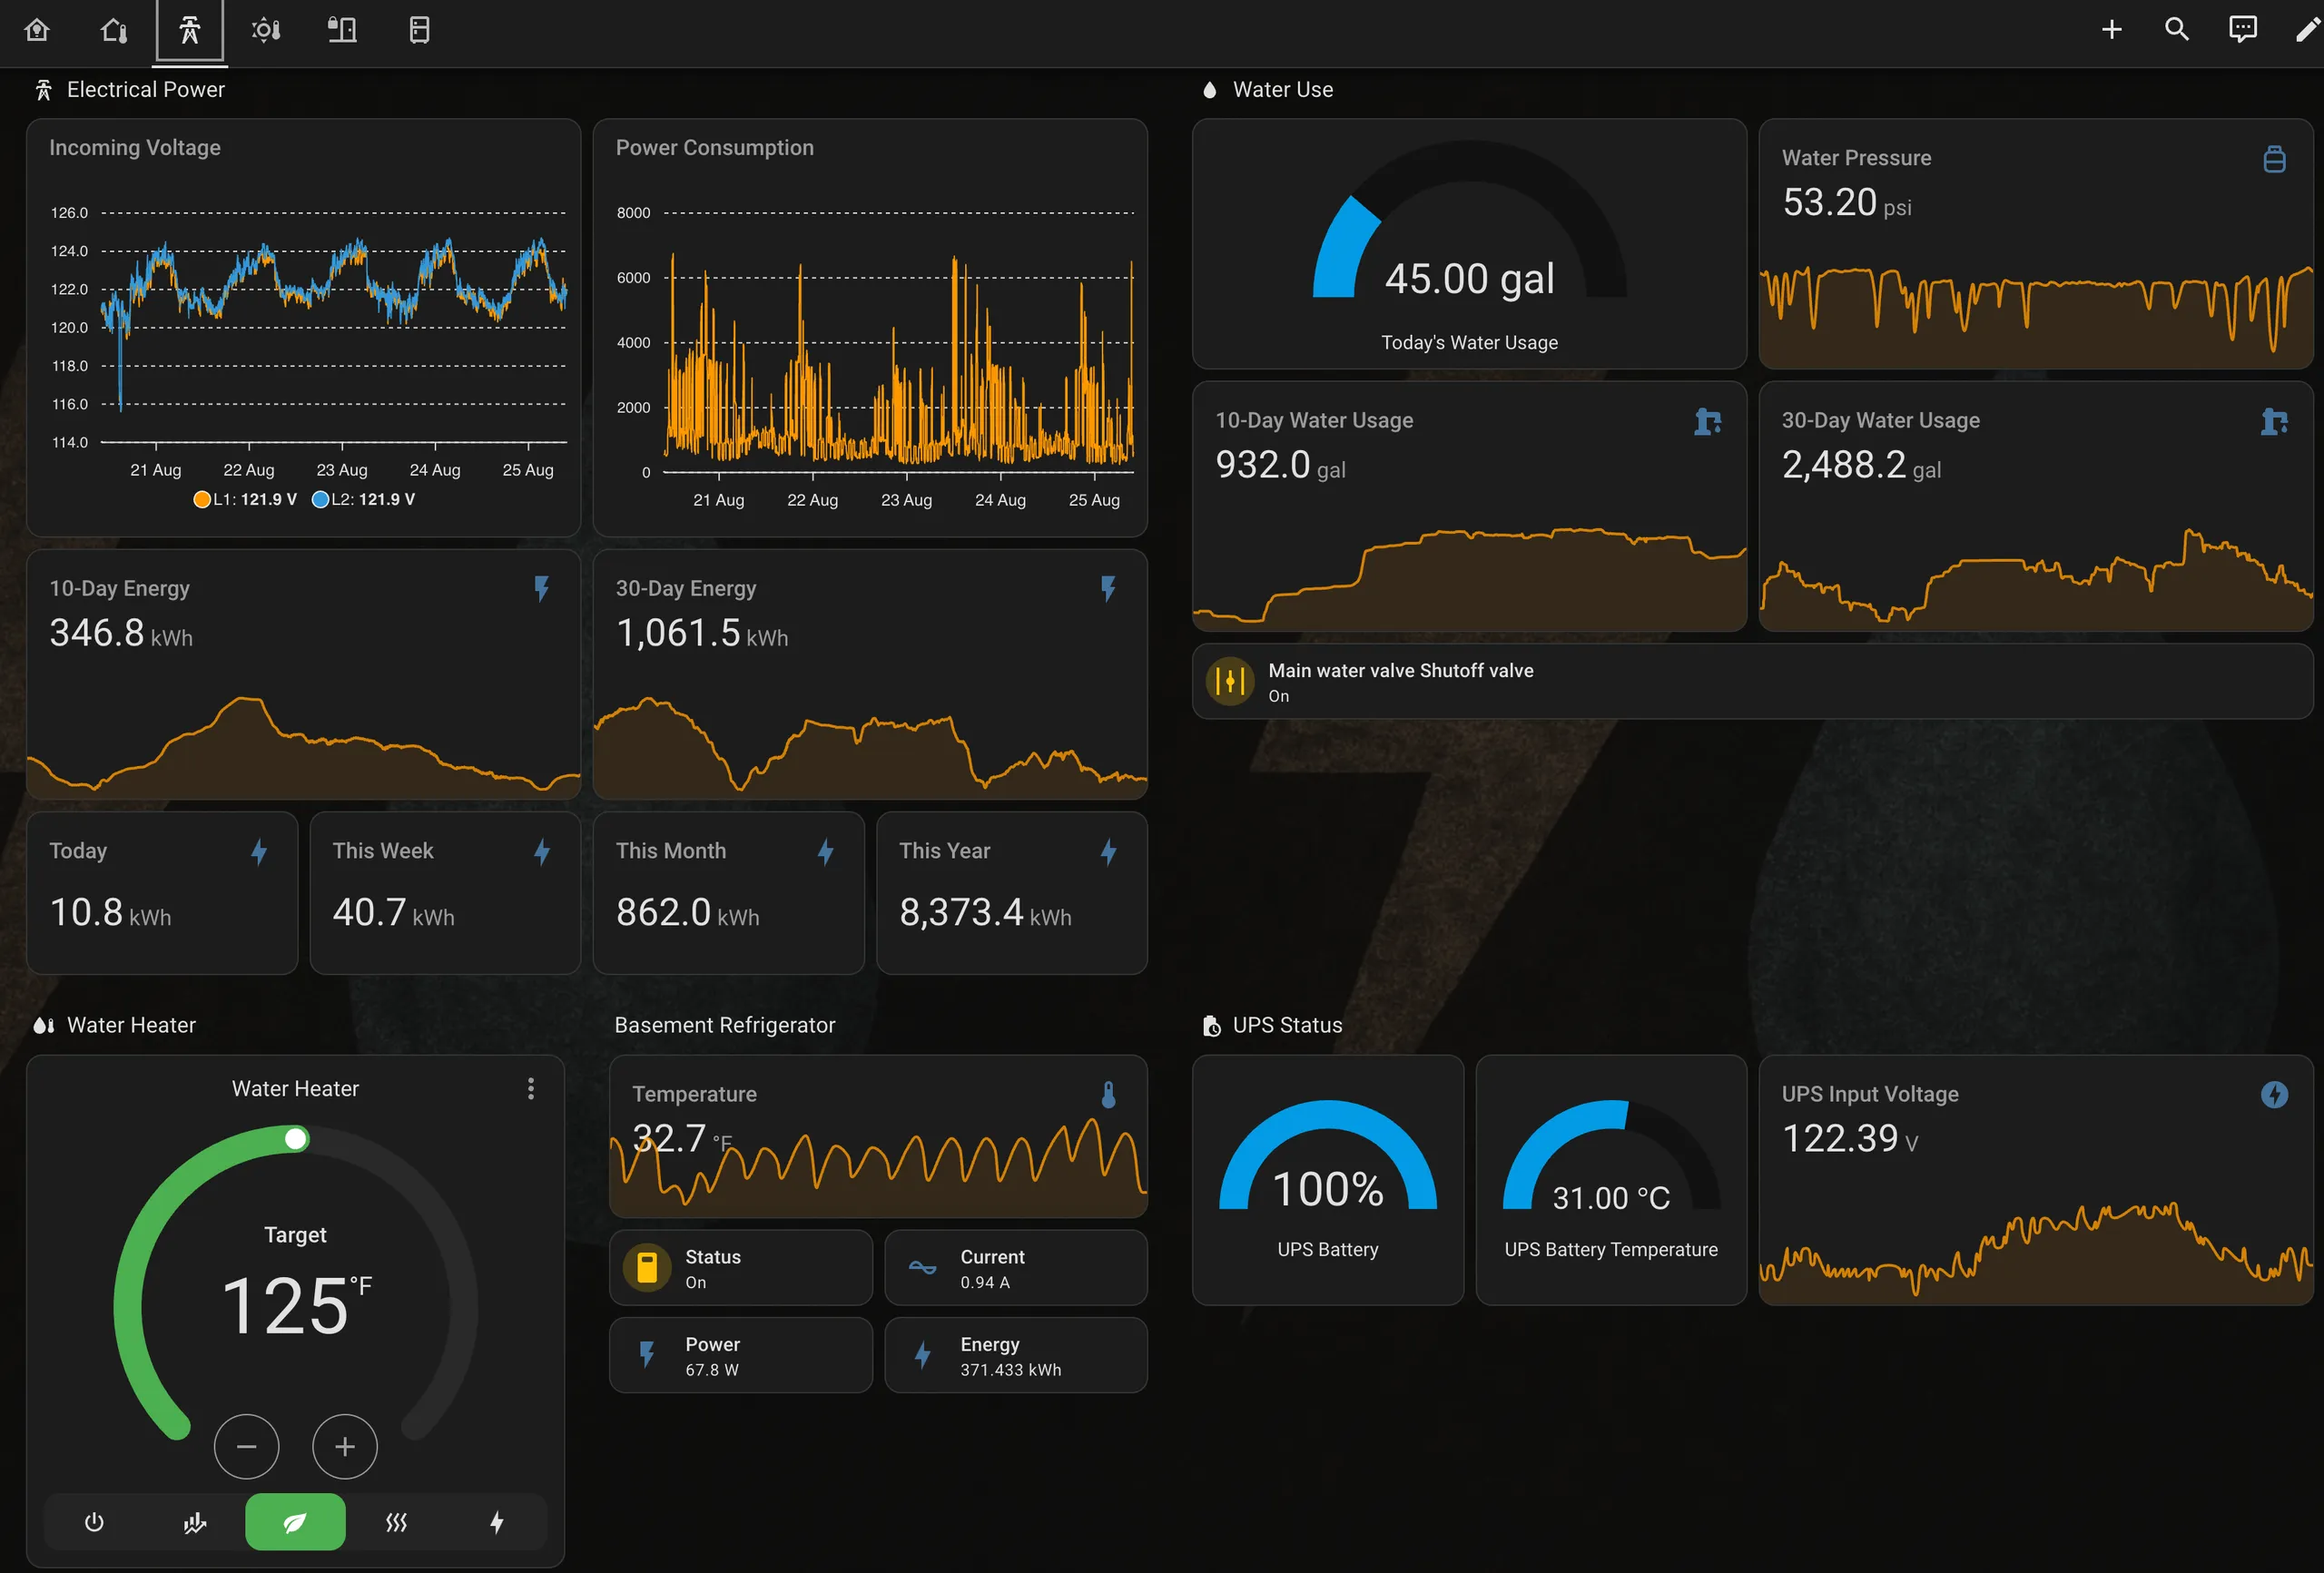
Rolling totals the hard way
Home Assistant is good at “today” and good at “this month.” It is not good at “the last 30 days,” which is the window that actually tells you whether something changed.
There is no integration for this, but the data is already in the database. Any
sensor with state_class: total_increasing gets a running cumulative sum
written to the statistics table. The last 30 days is just the latest sum minus
the sum from 30 days ago:
SELECT ROUND(
  (SELECT s.sum FROM statistics s
   JOIN statistics_meta sm ON s.metadata_id = sm.id
   WHERE sm.statistic_id = 'sensor.sense_268289_daily_energy'
   ORDER BY s.start_ts DESC LIMIT 1)
  -
  COALESCE(
    (SELECT s.sum FROM statistics s
     JOIN statistics_meta sm ON s.metadata_id = sm.id
     WHERE sm.statistic_id = 'sensor.sense_268289_daily_energy'
       AND s.start_ts <= (strftime('%s', 'now') - 2592000)
     ORDER BY s.start_ts DESC LIMIT 1),
    0)
, 1) AS value
Six of these run, giving 10-day and 30-day figures for energy, water and
rainfall. Adding a period means changing one number — 864000 seconds for ten
days, 2592000 for thirty — and the source statistic ID.
The catch is that these queries read a table Home Assistant maintains for its own purposes, so they are only as good as the retention setting. Retention went to two years at one point; two years of this database projected out to 20–27 GB, which is more than a Pi’s SD card wants to carry. It is back to one year.
Reading the UPS over Modbus
The UPS is the one device here that speaks an industrial protocol, and it is by
far the most satisfying integration on the box. Modbus TCP to 502, seven
registers: runtime remaining, battery state of charge, output power, current and
voltage, battery temperature, input voltage.
- name: UPS Battery SOC
  slave: 1
  address: 130
  data_type: uint16
  scale: 0.00195312
  unit_of_measurement: percent
That scale factor is 1/512. Every value on this device is a fixed-point
integer with a binary scale — output voltage is 1/64 V per count, battery
temperature 1/128 °C. Nothing in the register map is arbitrary, which is
pleasant after a decade of vendor protocols where it usually is.
Two automations watch it: a notification when input voltage drops below 115 V,
and a second one that fires when the sensor has been unavailable for five
minutes. The second matters more than the first. A monitoring system that goes
quiet looks exactly like a monitoring system with nothing to report.
Circulating air on an outlier
My office always runs hot. That is the reason this exists — the rest of the upstairs would be comfortable while the room I actually spend the day in was several degrees above it. The kitchen does the same thing on the downstairs zone. In both cases the thermostat cannot see the problem, because the thermostat only knows the temperature where the thermostat is.
With a sensor in each room, the fix is to run the blower when the rooms
disagree. Every five minutes, each sensor’s reading is compared against the
average of the other sensors in its zone — leave-one-out, so a badly wrong
sensor cannot drag down the average it is being judged against. If the largest
of those deviations is 4 °F or more, the fan goes to on.
Turning it back off is a separate automation with a tighter threshold: 2 °F. The gap between the two is deliberate. A single threshold would put the fan on a five-minute on-off cycle right at the boundary.
Three things keep it from being annoying:
- It only acts when fan mode is
auto. If you have set the fan yourself, that is your call and the automation stays out of it. - Four-hour cooldown after it turns the fan on, two hours after it turns it off.
- A sensor reporting
unavailableis dropped and the comparison runs on what is left. Below two valid sensors it does nothing at all.
The design was written with a 3 °F threshold and a single automation that turned
the fan on and then monitored in a wait_for_trigger loop until the deviation
cleared. Neither survived a month of living with it. The loop was hard to reason
about when Home Assistant restarted mid-run, and 3 °F fired more often than the
comfort improvement justified.
Weather, from the back yard
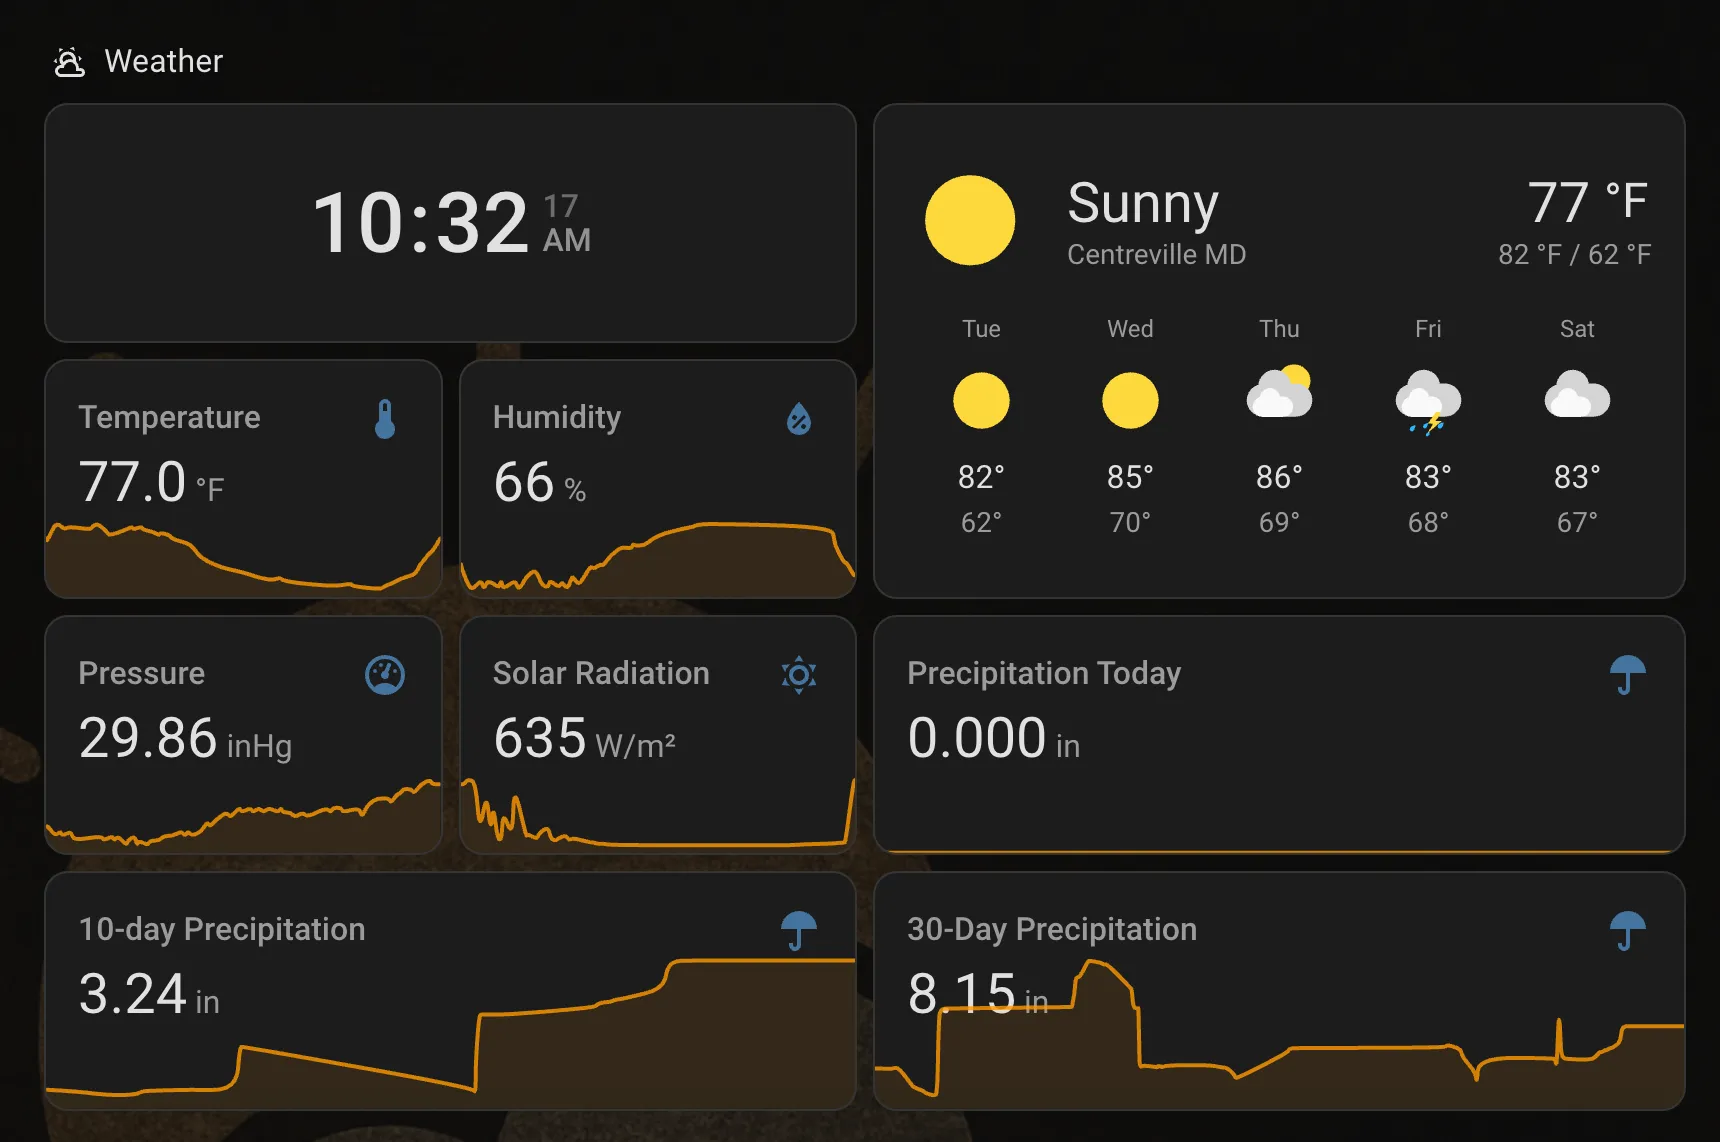
An Ambient Weather station in the yard supplies temperature, humidity, pressure, solar radiation and rainfall, and the same rolling-total trick gives 10-day and 30-day precipitation. Three soil moisture probes in the garden sit alongside it, which together answer the only weather question worth asking here — does anything need watering.
The solar radiation reading picked up a second job. A pair of lamps used to fade on a fixed sunset schedule, which is wrong on an overcast afternoon. Now they track the station’s solar reading every ten minutes, scaled to full brightness at 100 W/m² and dimming as the sky brightens past that. It is a one-line template and it is the automation that most feels like the house is paying attention.
Version control
Home Assistant’s own config lives on the box in /config, edited through a web
UI, with no history beyond what the built-in backups keep. That was fine until
an automation I had definitely improved started behaving worse and I had nothing
to diff against.
The config now lives in a git repo, synced over SFTP:
pull-config.shpullsconfiguration.yaml,automations.yaml,scripts.yaml,scenes.yamland the three dashboard files.push-config.shpushes a whitelist of hand-editable YAML back, and takes a local backup of the remote file before it overwrites anything. It requires explicit file arguments — there is no “push everything.”
Dashboards are deliberately pull-only. They are JSON dumps out of Home
Assistant’s .storage directory, not hand-written Lovelace YAML, and editing
them outside the UI is a good way to lose a dashboard.
The gitignore blocks secrets.yaml, the auth files and the SQLite database.
Version-controlling a config file that contains API tokens is the obvious way to
turn a nice housekeeping improvement into a security incident.
What still needs work
- The Pi is a single point of failure. It is on a UPS, which covers the power outage case and none of the SD card ones. A proper backup target off the box is overdue.
- Half the automations are UI-built. They are captured in
automations.yamlas device-ID triggers —device_id: f93c414c…— which are fine on the box and unreadable in a diff. The hand-written ones use entity IDs and are the only ones I can review a year later.